
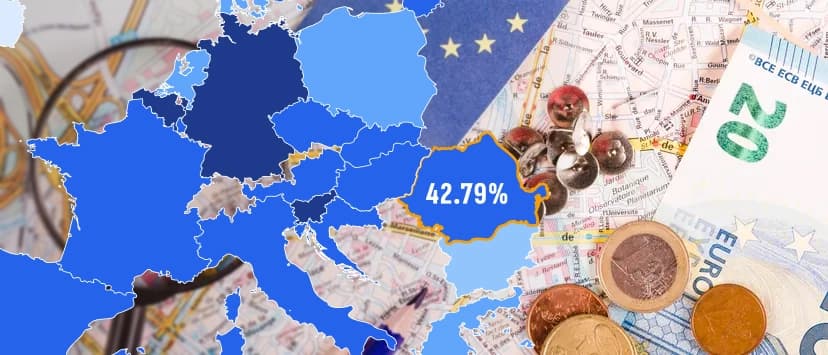
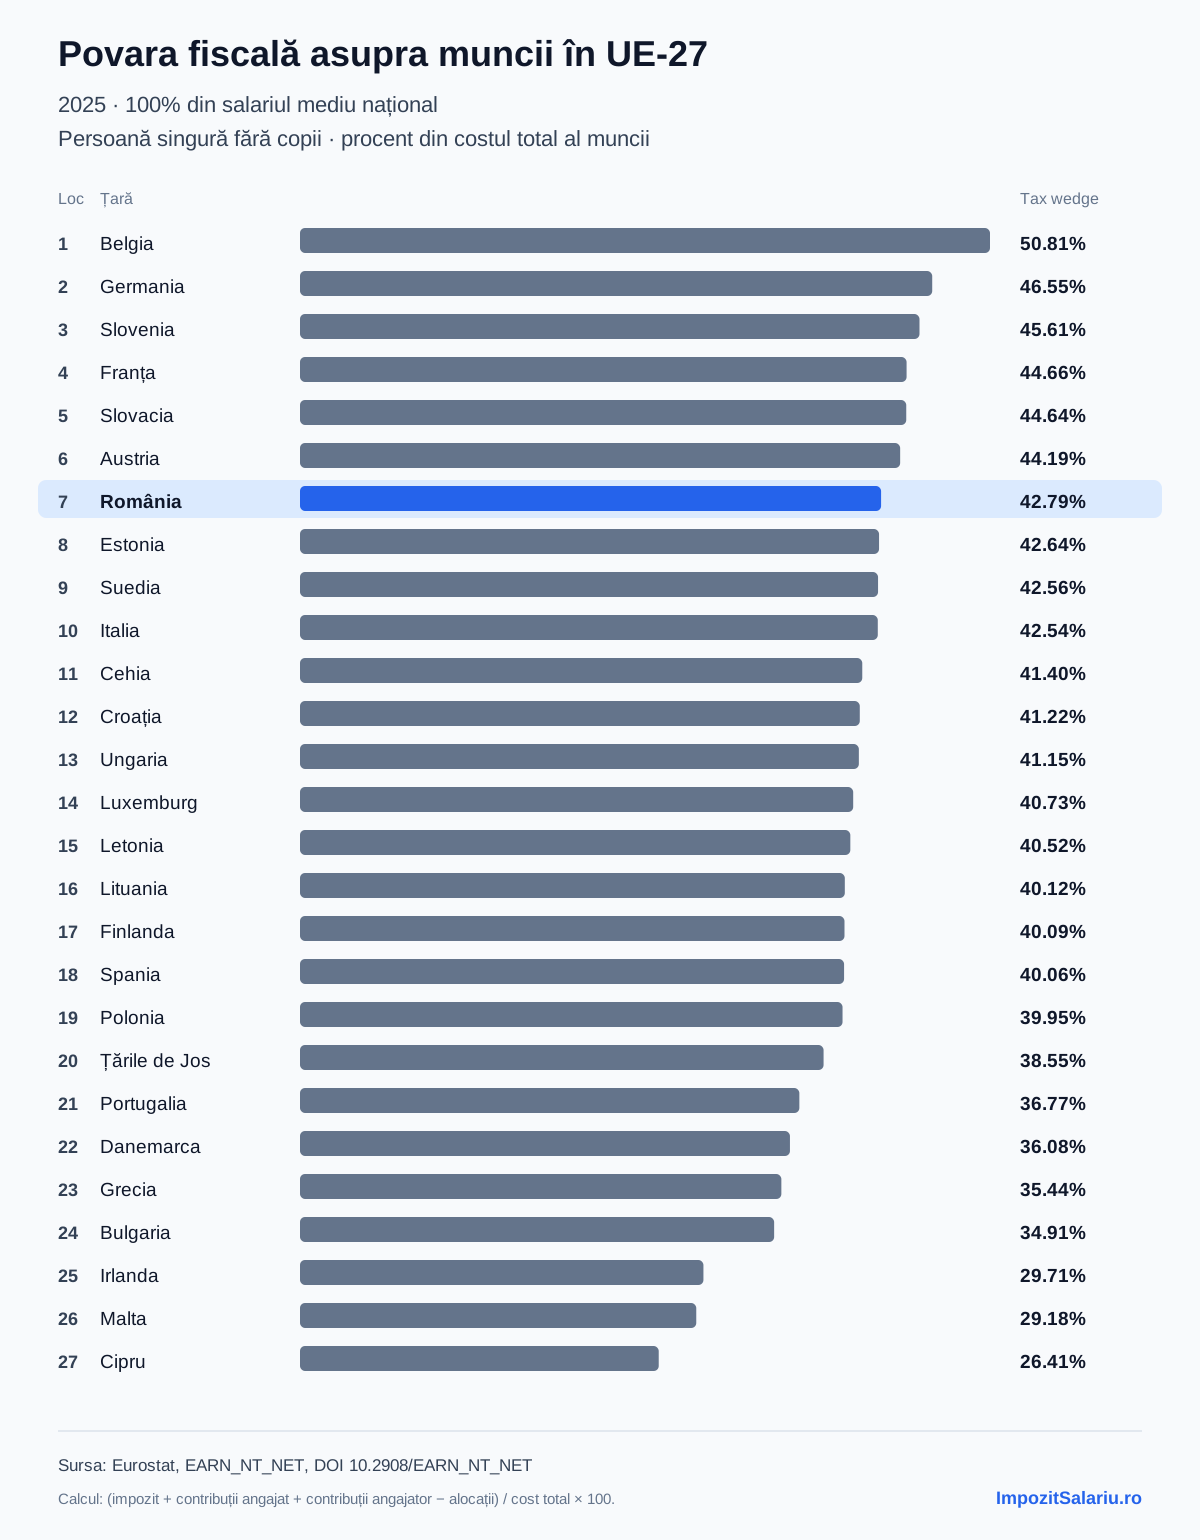
Romania does not have the highest salary taxes in the EU in the Eurostat comparison used here. For a single person without children earning their country's average wage, Romania ranks 7th out of 27. Belgium ranks first at 50.81%.
Of every 100 lei an employer spends in total on this job, 42.79 lei goes to income tax and social contributions in Romania's scenario, or 42.79% of total labour cost. Take-home pay means the employee's net salary. Eurostat calculates the indicator by comparing taxes and contributions with the employer's entire labour cost, not only with the deductions from gross salary.
An online map published by Geo All Day wrongly places Romania first for the overall tax burden on labour. The Facebook post compares employee deductions with gross salary. The comparison below uses the tax burden as a share of total labour cost, the indicator known as the tax wedge.
This analysis was updated on 14 August 2026 using the latest comparable data published by Eurostat. The values cover income earned in 2025, the normal reporting lag for an EU-wide ranking.
Romania's position changes with the earnings level: 2nd at 67% of the average wage, 7th at the average wage and 16th at 167%. The selector updates the map, Romania's result and the full ranking.
Compare the three earnings levels
Change the earnings level to see how the tax wedge and country rankings vary.
Single person without children earning 100% of the average earning, 2025 data
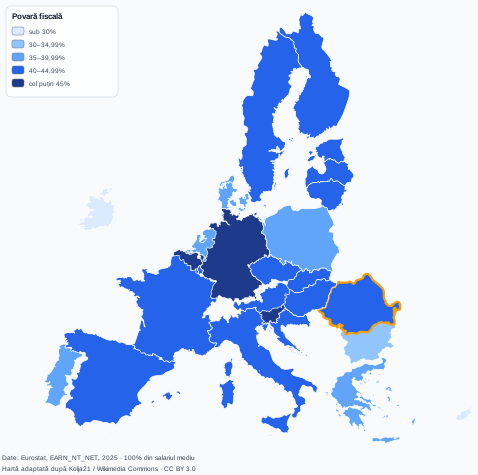
Romania has a tax wedge of 42.79% and is ranked 7 out of 27. Belgium ranks first at 50.81%.
- under 30%
- 30–34.99%
- 35–39.99%
- 40–44.99%
- at least 45%
Components of the result for Romania
Tax wedge of 42.79%, ranked 7 out of 27. Percentages use total labour cost; family allowances are subtracted from the total.
- Income tax
- 6.36%
- Employee social contributions
- 34.23%
- Employer social contributions
- 2.20%
- Family allowances (subtracted)
- 0.00%
Full ranking at 100% of average earnings
The table provides a complete alternative to the map. It uses the same scenario and the same unrounded values for ranking.
| Rank | Country | Tax wedge | Income tax | Employee contributions | Employer contributions | Allowances |
|---|---|---|---|---|---|---|
| 1 | Belgium | 50.81% | 18.68% | 11.02% | 21.10% | 0.00% |
| 2 | Germany | 46.55% | 10.82% | 17.65% | 18.08% | 0.00% |
| 3 | Slovenia | 45.61% | 11.63% | 20.11% | 13.87% | 0.00% |
| 4 | France | 44.66% | 11.04% | 8.58% | 25.04% | 0.00% |
| 5 | Slovakia | 44.64% | 8.22% | 9.84% | 26.58% | 0.00% |
| 6 | Austria | 44.19% | 8.53% | 14.03% | 21.63% | 0.00% |
| 7 | Romania | 42.79% | 6.36% | 34.23% | 2.20% | 0.00% |
| 8 | Estonia | 42.64% | 16.18% | 1.20% | 25.26% | 0.00% |
| 9 | Sweden | 42.56% | 13.33% | 5.32% | 23.91% | 0.00% |
| 10 | Italy | 42.54% | 11.07% | 7.19% | 24.29% | 0.00% |
| 11 | Czechia | 41.40% | 7.47% | 8.67% | 25.26% | 0.00% |
| 12 | Croatia | 41.22% | 9.89% | 17.17% | 14.16% | 0.00% |
| 13 | Hungary | 41.15% | 13.27% | 16.37% | 11.50% | 0.00% |
| 14 | Luxembourg | 40.73% | 17.89% | 10.83% | 12.01% | 0.00% |
| 15 | Latvia | 40.52% | 12.94% | 8.50% | 19.09% | 0.00% |
| 16 | Lithuania | 40.12% | 19.22% | 19.16% | 1.74% | 0.00% |
| 17 | Finland | 40.09% | 15.75% | 7.10% | 17.25% | 0.00% |
| 18 | Spain | 40.06% | 12.16% | 4.89% | 23.02% | 0.00% |
| 19 | Poland | 39.95% | 11.57% | 11.38% | 17.00% | 0.00% |
| 20 | Netherlands | 38.55% | 8.74% | 15.55% | 14.27% | 0.00% |
| 21 | Portugal | 36.77% | 8.69% | 8.89% | 19.19% | 0.00% |
| 22 | Denmark | 36.08% | 35.33% | 0.25% | 0.50% | 0.00% |
| 23 | Greece | 35.44% | 6.57% | 10.98% | 17.89% | 0.00% |
| 24 | Bulgaria | 34.91% | 7.23% | 11.56% | 16.12% | 0.00% |
| 25 | Ireland | 29.71% | 15.99% | 3.69% | 10.03% | 0.00% |
| 26 | Malta | 29.18% | 13.44% | 7.87% | 7.87% | 0.00% |
| 27 | Cyprus | 26.41% | 3.15% | 9.92% | 13.34% | 0.00% |
Data source: Eurostat, EARN_NT_NET, 2025. Values are rounded to two decimal places for display only.
The denominator used to calculate the tax burden
The labour tax wedge is the share of total labour cost made up of personal income tax, employee social security contributions and employer social security contributions, after subtracting family allowances.
Total labour cost is gross salary plus the employer's social contributions. Deductions as a percentage of gross salary and the tax wedge as a percentage of total labour cost use different denominators, so they cannot produce the same ranking.
The formula used for all three scenarios is:
(income tax + employee contributions + employer contributions − family allowances)
÷ total labour cost × 100
How Romania's 42.79% is calculated
At 100% of average earnings, Eurostat's annual values for Romania are EUR 23,129.01 in total labour cost, EUR 1,470.30 in income tax, EUR 7,917.02 in employee contributions and EUR 508.95 in employer contributions. The scenario for a person without children includes no family allowances.
(1,470.30 + 7,917.02 + 508.95 − 0) ÷ 23,129.01 × 100 = 42.7873%
Rounded for display, the result is 42.79%. Income tax accounts for 6.36% of total labour cost, employee contributions for 34.23% and employer contributions for 2.20%.
What this means for your salary in Romania in 2026
The Eurostat ranking is an annual comparison for 2025, constructed at three earnings levels measured against each country's average wage. A Romanian payslip for July 2026 uses the rules for that month and the options of a particular employment contract, so your result may differ.
For the Romanian context, read how the minimum wage and tax-free amount changed on 1 July 2026 and the guide to gross salary, net pay, taxes and total labour cost in Romania. You can then enter the details of your contract in the Romanian salary calculator. None of the monthly results on those pages forms part of the EU ranking.
Why total labour cost minus net earnings is not enough
Eurostat's EARN_NT_NET series publishes the tax components and net earnings. For some countries, the net field contains small differences or other adjustments that do not appear in the four components of the indicator. The formula (total labour cost − net earnings) / total labour cost therefore differs from the official EARN_NT_TAXWEDGE series in nine countries at 67% of average earnings.
The published calculation uses the tax components. The signed difference between published net earnings and reconstructed net earnings remains in the CSV under the reconciliation field as a technical data check. It is not a tax and does not enter the map or ranking. All 27 calculated values for the 67% scenario were checked at the precision published by the official indicator.
How Romania's position changes at different earnings levels
Each level is measured against the average wage in the relevant country. The comparison does not apply the same nominal salary in every Member State and does not estimate what net pay the same nominal Romanian salary would yield in another country.
Romania's percentage is almost the same in all three cases. Other countries have tax reductions, benefits or contributions that vary with earnings, so Romania moves from 2nd to 7th and then to 16th place.
Two countries with similar percentages may have different systems. One may collect more through income tax, while another relies more on employee or employer contributions. Family allowances reduce the indicator for eligible households; the scenario analysed here is for a person without children.
What this ranking does not show
The data covers 2025 and was published or updated by Eurostat in 2026. The map includes the 27 Member States of the European Union, not every country in Europe.
Results can change with earnings, marital status, children, deductions, cash benefits and the tax year. The three levels describe a single person without children and do not represent every employee in a country. The map is a thematic visualisation; the table and CSV provide the exact values.
The geometry was adapted from European Union main map.svg, created by Kolja21 and published on Wikimedia Commons under CC BY 3.0. We retained the shapes of the 27 Member States, normalised their identifiers and replaced the original colours with the scale used in this analysis.
Methodology, data and reuse
- Period
- 2025 (Eurostat data published or updated in 2026)
- Verified on
- Dataset version
- eurostat-2025-2026-08-14.1
Scenario: single person without children earning 67%, 100% or 167% of the average wage in their country.
- 2025 reference year and annual frequency
- the 27 Member States of the European Union
- earnings are measured against each country's average wage, not as the same nominal amount in every country
- the formula subtracts family allowances and records the net-income reconciliation difference separately
Download data and charts
Sources
- Eurostat EARN_NT_NET, annual net earnings (accessed 2026-08-14)
- Eurostat EARN_NT_TAXWEDGE, official validation series at 67% (accessed 2026-08-14)
Suggested attribution: Data and visualisation: ImpozitSalariu.ro, 'The EU labour tax wedge', version eurostat-2025-2026-08-14.1, https://www.impozitsalariu.ro/en/articles/romania-eu-labour-tax-wedge-eurostat. Map geometry adapted from European Union main map.svg by Kolja21, Wikimedia Commons, CC BY 3.0.
You may reuse the calculations and original chart with the attribution above. The map geometry remains available under CC BY 3.0; the derivative retains the 27 shapes needed for this analysis and uses a new colour scale.
The tax engine, order of operations and rounding rules are described in the calculator methodology.